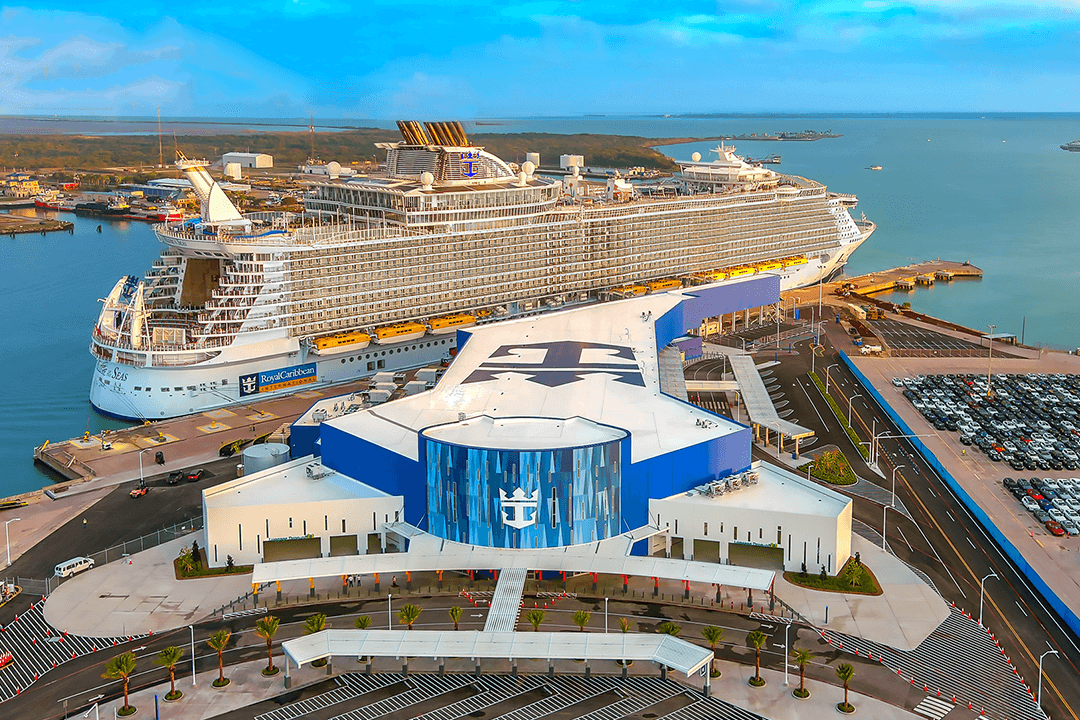
Port Galveston Cruise Terminal 10
Galveston Wharves Cruise Terminal is a two story, 160,000 square-foot terminal building designed to maximize cruise terminal operations while creating a welcoming environment for passengers and crew...
Gain deeper insights into the maritime industry with detailed updates on key developments and trends, meticulously curated by our team of specialists.
With Q3 earnings now in, the cruise industry's momentum remains strong, reflected in solid bookings and continued growth in both capacity and revenue. The key takeaway from Q2—that the cruise environment is increasingly defined by intentional, guest-driven, yield-oriented growth, fueled largely by curated destination strategies—still holds true.
This quarter, however, the narrative evolved. Attention shifted toward financial discipline, as all three public operators highlighted strengthened balance sheets and steady progress in reducing debt from their peak levels (most reached in 2022). At the same time, lower leverage and clearer debt maturity profiles are creating room to fund growth, particularly in destination projects.
In this edition of BAPerspectives, we examine passenger and revenue growth, occupancy trends, and current debt and leverage from a post‑pandemic recovery perspective, showing how these factors create financial flexibility for growth. We also explore how today's financing choices and investments in ships and owned/exclusive destinations are shaping the near future, with capital extending beyond vessels to shore-side assets, which now serve as an incremental growth engine that strengthens both revenue and the balance sheet.
Across the first nine months of 2025, the three operators carried nearly 19.6 million passengers—up 16.7% from 2019. Growth was particularly strong for RCG (+41%) and steady for Carnival (+6%) and NCLH (+8%). Demand strength is also reflected in gross revenue per available passenger cruise day (APCD), a measure of revenue generated per passenger per day, which has jumped 36–42% versus 2019.
Occupancy levels further highlight the market's strength, exceeding pre-pandemic benchmarks: 112% for Carnival and RCG and 106% for NCLH, indicating higher demand per sailing.
By year end, the industry is estimated to carry roughly 3.6 million more passengers this year across these three operators than in 2019, while per-passenger revenue per day has jumped 36–42%. Combined, this represents a massive surge in overall revenue, demonstrating that not only are more people sailing, but each sailing is generating substantially more value.
Higher passenger volumes and strong per-passenger revenue are generating robust cash flow, allowing cruise lines to reduce debt while continuing to invest in destinations and shore infrastructure.
Carnival, the largest of the three operators and carrying the most debt relative to its size, has shown the most consistent reduction. Net debt fell by roughly $2 billion per year from 2022 through 2024, reaching $24.7 billion as of Q3 2025. Its leverage ratio declined from 4.3x to 3.6x, giving the company flexibility to invest in destinations while keeping debt reduction a priority. With few new ship deliveries planned over the next few years, more free cash flow can go toward debt repayment—potentially paving the way for a future shift toward returning capital to shareholders.
"Given the progress we have made and while still a top priority, it is great to be able to say that debt reduction no longer has to be priority 1, 2 and 3. We can soon pivot to diverting some of that effort to returning capital to shareholders as well."
RCG's debt profile remains stable, with net debt slightly higher than last year at $19.8 billion, reflecting ongoing investment in ships and destinations. The company has been steadily paying down debt since 2022, and its leverage ratio has fallen below 3x, providing financial flexibility to expand its destination portfolio—from two assets today to eight by 2027—while also returning cash to shareholders. Since lifting lender restrictions in 2024, RCG has returned approximately $1.6 billion in dividends.
NCLH's net debt rose to $14.4 billion, largely due to the delivery of Oceania Allura and strategic refinancing actions, including replacing secured debt with unsecured notes. Despite this increase, liquidity remains strong at $1.8 billion, supporting operations, growth investment, and debt reduction, which leadership continues to make "our number one priority".
Across all three operators, stronger cash flow and reduced leverage provide a foundation to both pay down debt and continue investing in destinations and ships, further growing their business and reinforcing the link between financial health and operational expansion.
A summary of each operator's debt profile, refinancing moves, and implications is provided at the end of this BAPerspective.
Across the industry, improved balance sheets are enabling operators to diversify assets, both ships and shore-side destinations. Owned and exclusive destinations are materially cheaper and faster to deliver than new ships, yet deliver similar levers: pricing power, onboard spend, guest satisfaction, and incremental revenue.
The Q3 2025 results confirm that the industry is striking a balance between financial discipline and growth. Stronger balance sheets, supported by refinancing that has smoothed near-term maturities and steadied interest costs, allow operators to invest strategically in both ships and destinations. With pricing and occupancies at all-time highs, operating cash flow is doing more of the work, creating the next wave of incremental revenue while gradually reducing leverage. Destinations are emerging as a key growth engine, complementing fleet expansion and supporting shareholder returns. Across Carnival, RCG, and NCLH, the top priority remains strengthening the balance sheet while positioning themselves to accommodate growth through owned and exclusive destinations.
(in USD millions, except gross revenue per APCD)
| Carnival | 2019 | 2021 | 2022 | 2023 | 2024 | Q3 2025 |
|---|---|---|---|---|---|---|
| Long-term debt | 9,675 | 28,509 | 31,953 | 28,483 | 25,936 | 25,064 |
| Current portion of long-term debt | 1,596 | 1,927 | 2,393 | 2,089 | 1,538 | 1,417 |
| Short-term borrowings | 231 | - | - | - | - | - |
| Less: Cash and cash equivalents | (518) | (9,139) | (4,029) | (2,415) | (1,210) | (1,763) |
| Net Debt | 10,984 | 21,297 | 30,317 | 28,157 | 26,264 | 24,718 |
| Leverage | 2.0 | -3.9 | -14.4 | 6.7 | 4.3 | 3.6 |
| Load Factors | 107% | 56% | 75% | 100% | 105% | 112% |
| Gross Revenue per APCD | $233.75 | $130.68 | $167.85 | $236.51 | $261.73 | $331.42 |
| RCG | 2019 | 2021 | 2022 | 2023 | 2024 | Q3 2025 |
|---|---|---|---|---|---|---|
| Long-term debt | 8,414 | 18,847 | 21,303 | 19,732 | 18,473 | 17,203 |
| Current portion of long-term debt | 1,187 | 2,243 | 2,088 | 1,720 | 1,603 | 3,074 |
| Commercial Paper | 1,424 | - | - | - | - | - |
| Less: Cash and cash equivalents | (244) | (2,702) | (1,935) | (497) | (388) | (432) |
| Net Debt | 10,791 | 18,389 | 21,456 | 20,955 | 19,688 | 19,845 |
| Leverage | 3.2 | -6.7 | 39.1 | 4.9 | 3.8 | <3 |
| Load Factors | 108% | 49% | 85% | 106% | 109% | 112% |
| Gross Revenue per APCD | $264.30 | $130.20 | $214.59 | $296.27 | $326.08 | $375.14 |
| NCLH | 2019 | 2021 | 2022 | 2023 | 2024 | Q3 2025 |
|---|---|---|---|---|---|---|
| Long-term debt | 6,055 | 11,568 | 12,630 | 12,314 | 11,777 | 13,645 |
| Current portion of long-term debt | 746 | 877 | 991 | 1,745 | 1,324 | 876 |
| Less: Cash and cash equivalents | (253) | (1,747) | (947) | (402) | (191) | (167) |
| Net Debt | 6,548 | 10,698 | 12,674 | 13,657 | 12,910 | 14,354 |
| Leverage | 3.6 | -3.3 | -10.7 | 6.2 | 4.6 | 5.4 |
| Total Load Factors | 107% | 53% | 73% | 103% | 105% | 106% |
| Gross Revenue per APCD | $336.00 | $191.90 | $275.75 | $377.44 | $404.38 | $457.82 |
| Brand | Action | Implication |
|---|---|---|
| CCL |
|
|
| RCG |
|
|
| NCLH |
|
|

Galveston Wharves Cruise Terminal is a two story, 160,000 square-foot terminal building designed to maximize cruise terminal operations while creating a welcoming environment for passengers and crew...
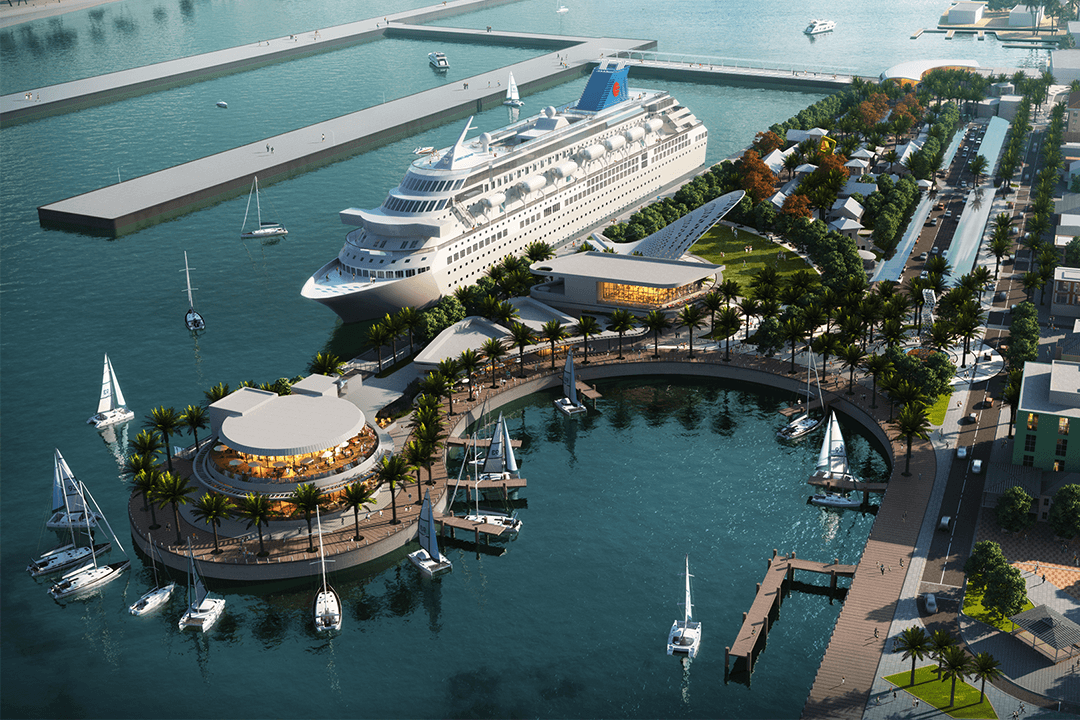
BA's design for the waterfront features a completely transformed Port and Welcome Center, additional mega berths to accommodate the largest cruise ships in the world...
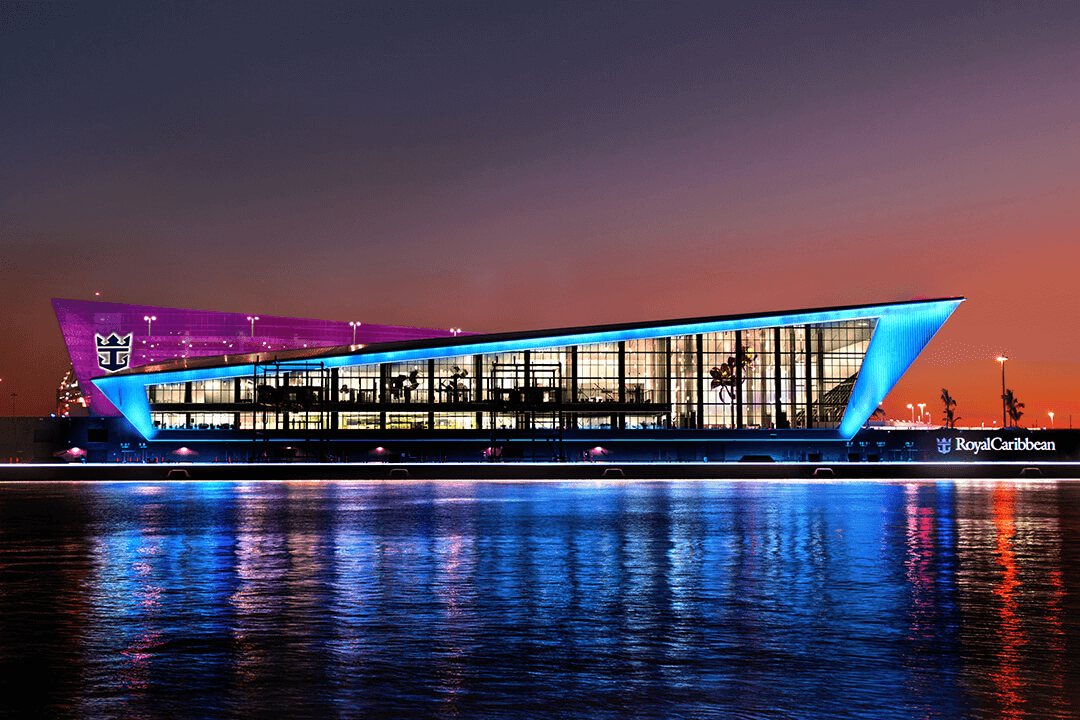
BA was commissioned by RCCL as the architect of record for the new flagship state-of-the-art high-tech Terminal A...

Bermello Ajamil & Partners, Inc. BA, in conjunction with the Renaissance Planning Group, is preparing a Master Plan of the Tampa Port Authority's Waterfront Properties...
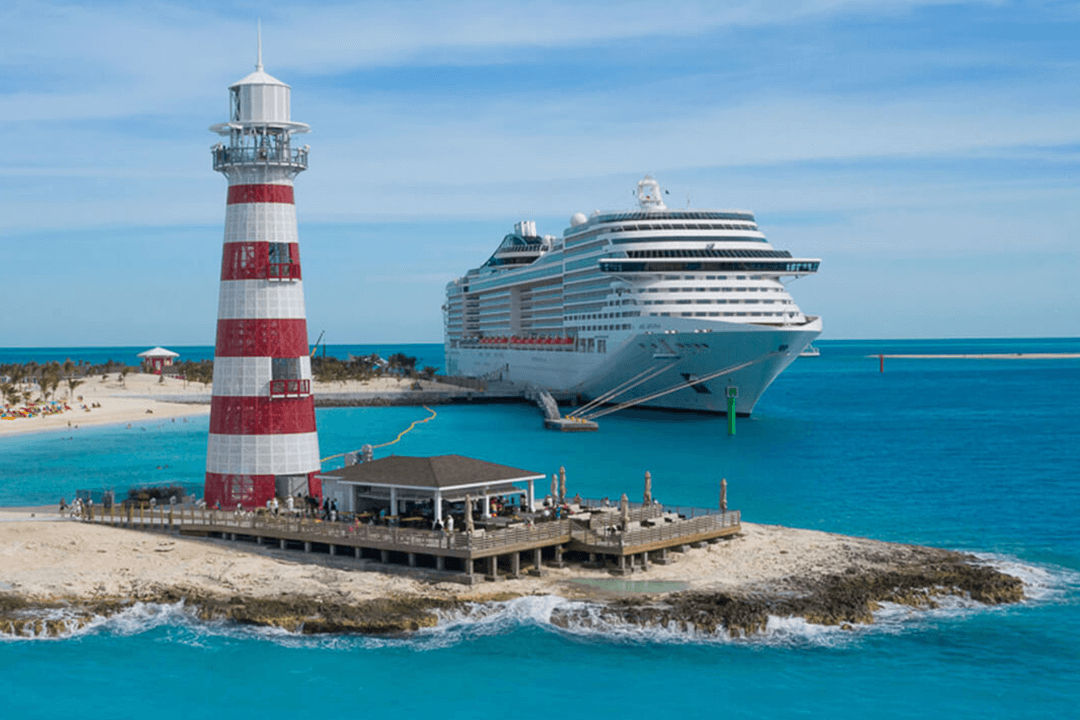
Ocean Cay was a 5-year design-build project that BA led as the prime consultant. The ultimate vision for Ocean Cay was to reinvent what a cruise destination island should be for its guests...
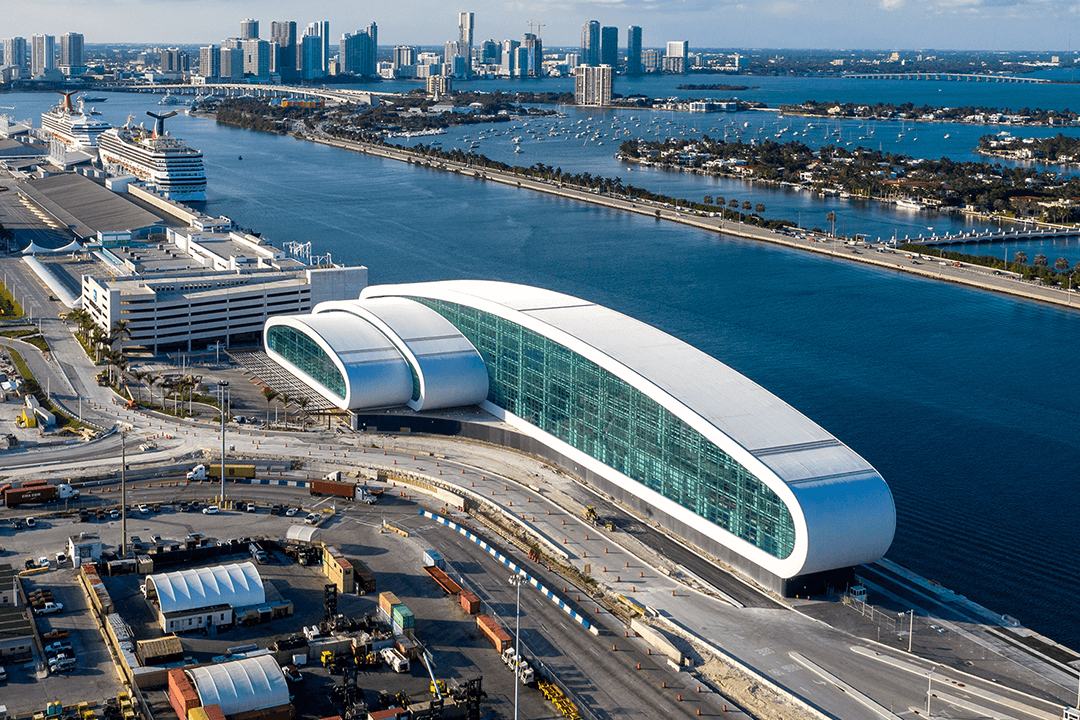
Terminal B accommodates cruise vessels of more than 5,000 passengers, and features new technology to support quicker and more efficient embarkation and disembarkation processes, as well as expedited security screening and luggage check-in...