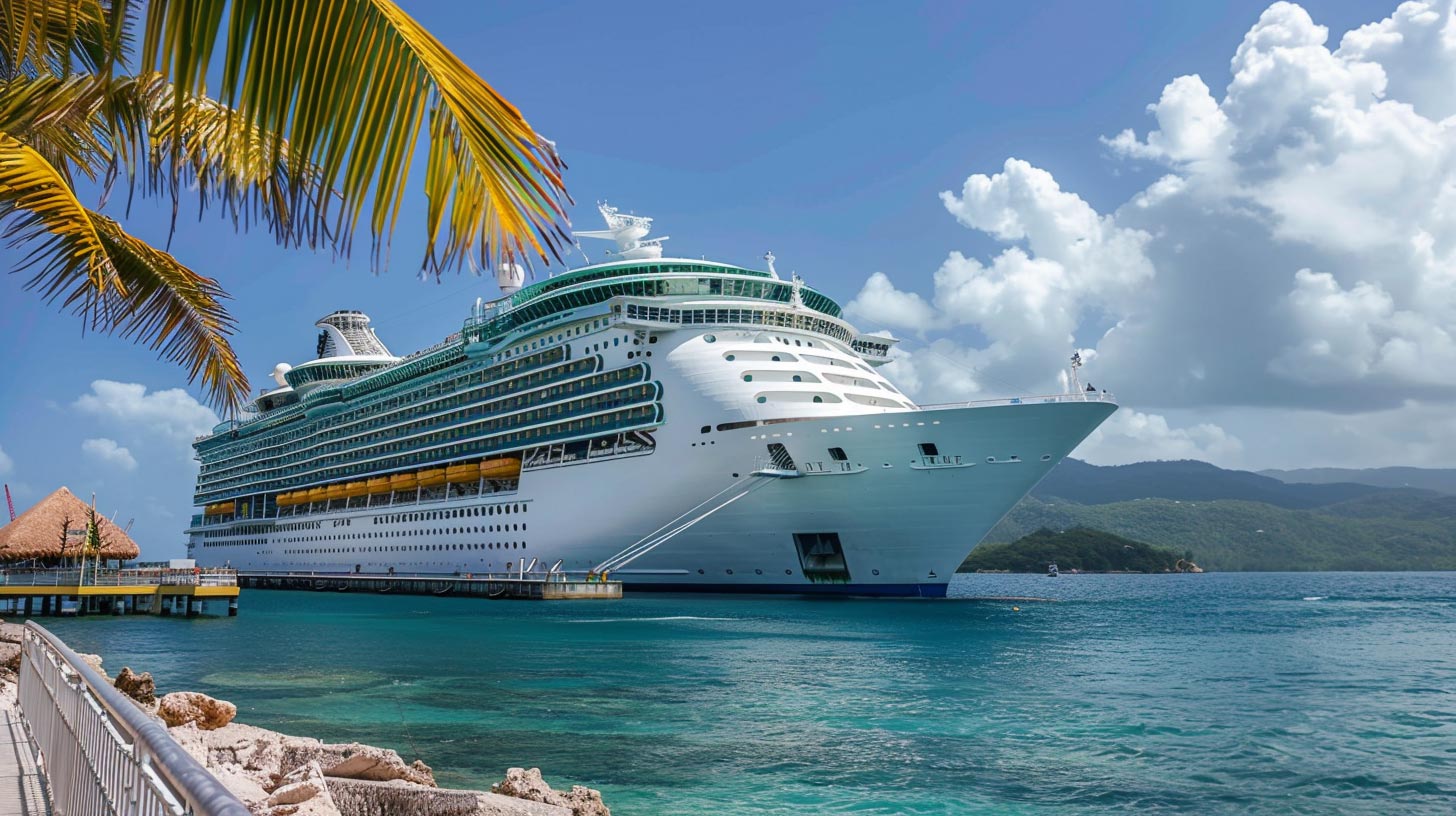
Nassau Cruise Port Global
BA’s design for the waterfront features a completely transformed Port and Welcome Center, additional mega berths to accommodate the largest cruise ships in the world...
Gain deeper insights into the maritime industry with detailed updates on key developments and trends, meticulously curated by our team of specialists.

2022 was a monumental transition year where operators placed ships back in operation throughout the first half of the year. After almost three years of uncertainty, the restart was successful, but with mixed results by markets and brands.
What happens next in 2023 with the cruise industry that now has its fleet back in operation? This bulletin explores where the industry is today, compares 2022 metrics with those in 2019, and provides guidance as to what 2023 will look like – its challenges and opportunities.
Capacity – Despite the retirement of many of the older vessels from the fleets, today the industry is larger with more lower berth capacity than in 2019.
Passengers - Given the current trajectory of sailings and capacities, it is all but anticipated that 2023 will see a full year of recovery in terms of passenger numbers (and revenues). In fact, 2023 could even exceed the overall industry passenger numbers of 2019.
Debt – All three major listed cruise companies have more than doubled the amount of total debt. As a result of the debt, operators are executing somewhat different strategies going forward, but among common themes are:
While this may negatively impact or delay growth strategies, particularly as it relates to investments in ships (as can be seen with ships on order 2019 v. 2022), technology, and the expansion of land-based developments, these operators have not announced any cancelations to date.
Instead, what is being seen is an evolution in the cruise business streamlining business to maximize profit and reduce cash demand. Investments in infrastructure will need to be carried out more by the destinations or third parties, to fill the gap in infrastructure development while the major cruise lines remain capital constrained.
Below find a comparison of key metrics of 2019 versus 2022 – such as passengers carried, occupancy levels, berths, ships, and more – based on the annual report data published by Carnival Corp (CCL), RCG, and NCLH.


*BA database estimate. Carnival’s year-end report did not include actuals.